Can I See the Rolling 12 Month Data for Closed Sales?
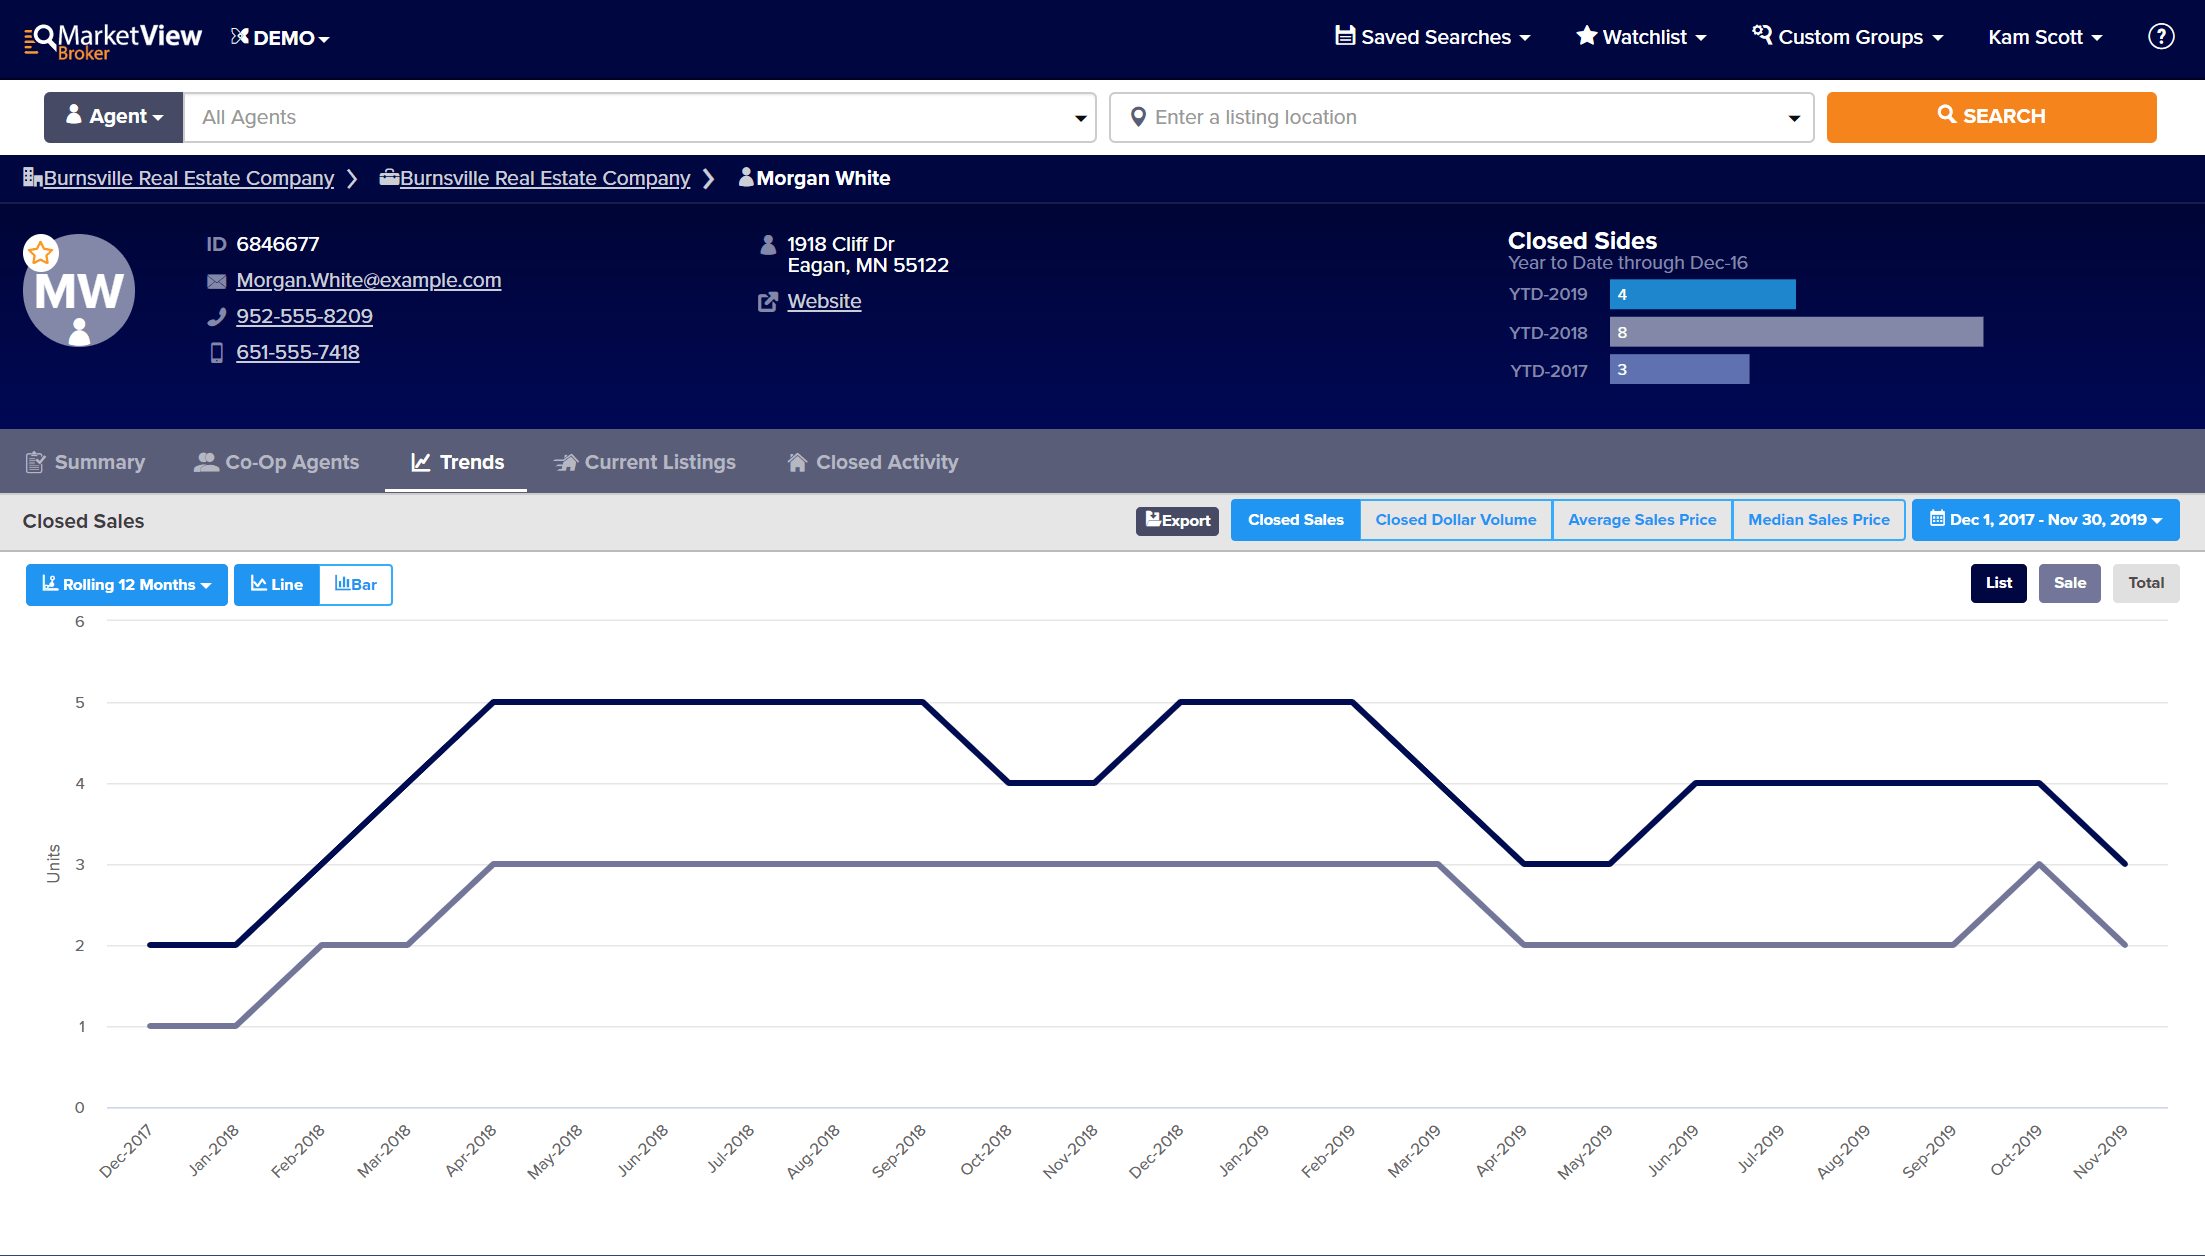
You can see the Rolling 12-Month data (and other time frames) on the Trends tab for an agent or office.
Select an agent in your office.
Select the Trends tab.
Select Rolling 12 Months.

Click the image for the full size.
You will be able to view the data as a line or bar graph and export it.
Step 1
Select an agent in your office.
Step 2
Select the Trends tab.
Step 3
Select Rolling 12 Months.

Click the image for the full size.
You will be able to view the data as a line or bar graph and export it.
