How Do I See the Long-Term Stats of an Agent, Office or Firm?
With MarketView Broker, you can see up to 10 years of performance stats on agents, offices, and firms, depending on your MLS. This allows you to see the lifecycle over the long term, which may or may not be similar to their most recent performance.
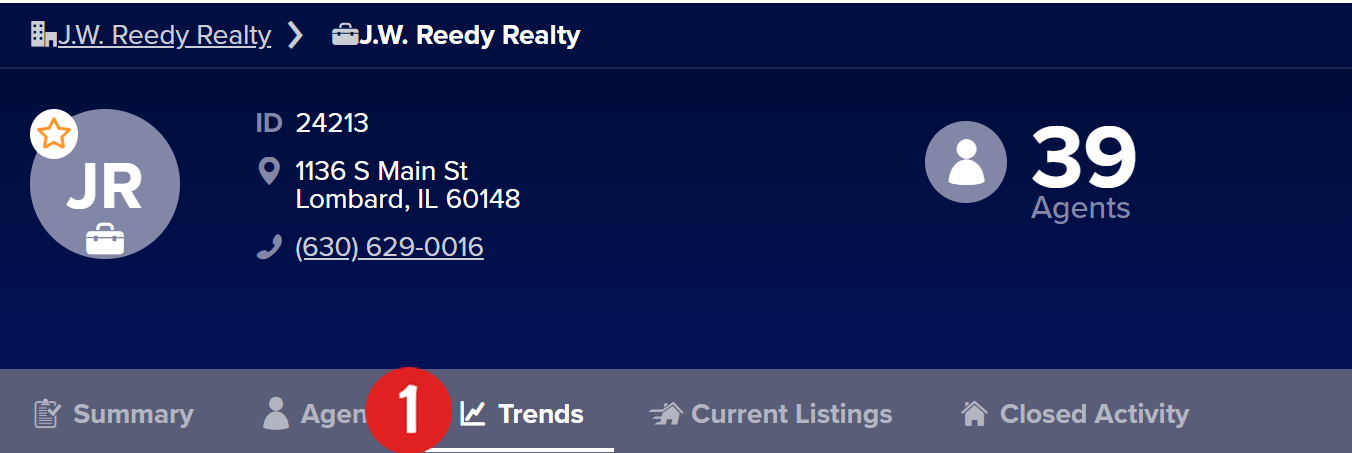
From an agent, office, or firm details page, click the Trends tab.

Click on the image to see it full-sized.
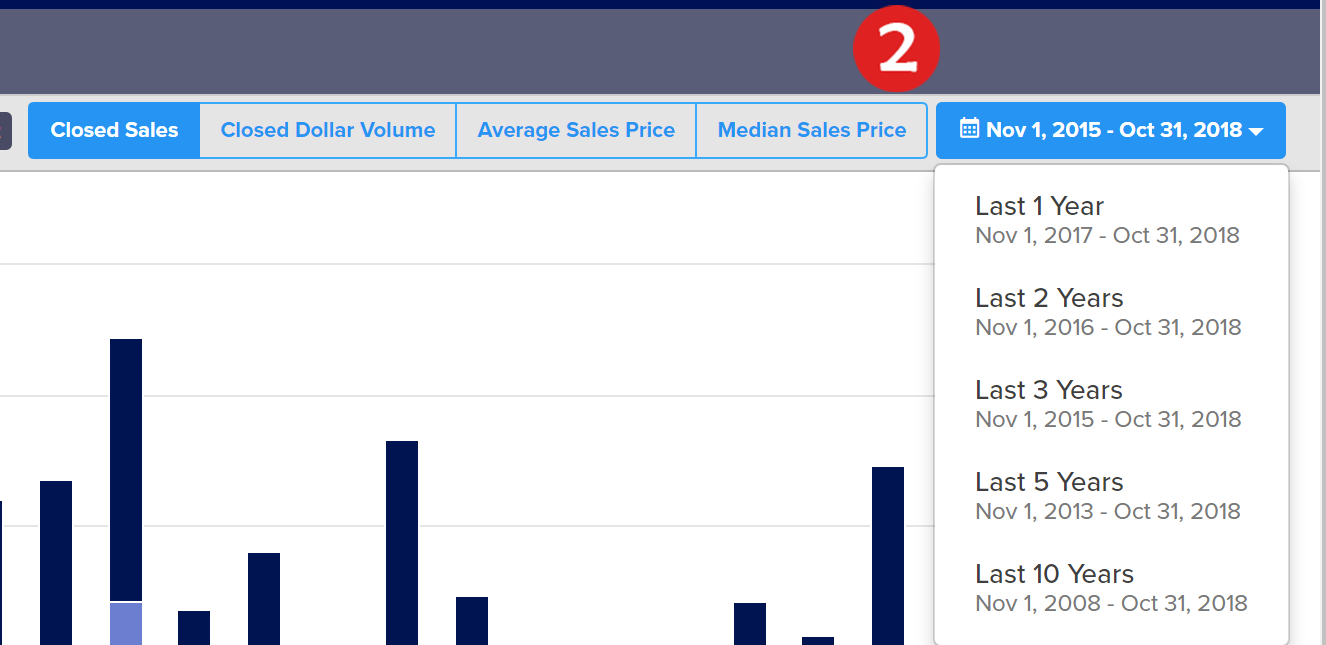
Click the time range picker on the right side of the page.

Click on the image to see it full-sized.
Select All Years. It will tell you how long of history will be displayed.
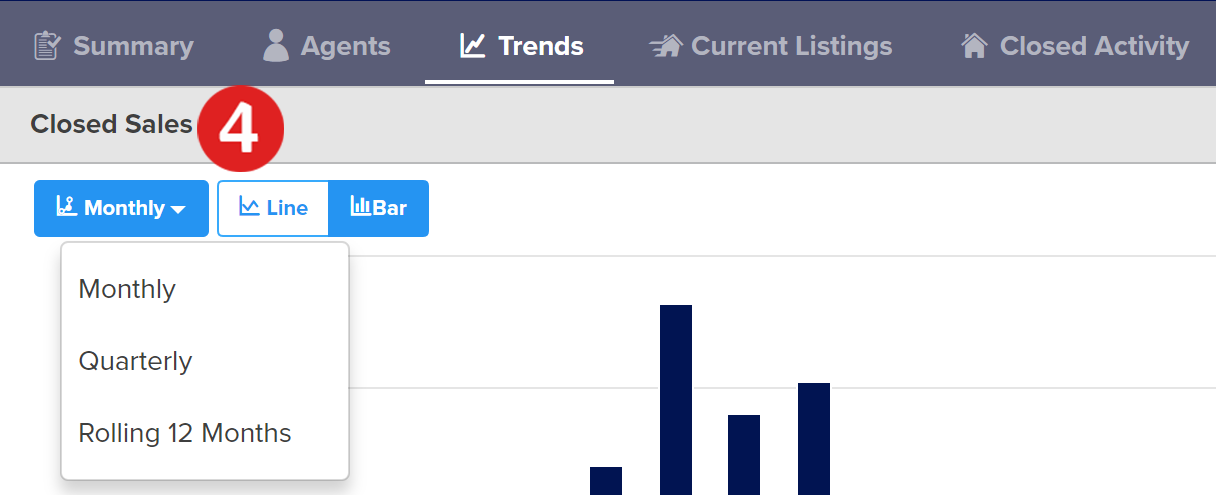
Click through the different statistics options available and toggle between a line and bar chart.
You may also want to see the data charted in Quarterly or Rolling 12 months by selecting the drop-down on the left.

Click on the image to see it full-sized.
Your MLS may have fewer years of data available

Click the image for the full size
Step 1
From an agent, office, or firm details page, click the Trends tab.

Click on the image to see it full-sized.
Step 2
Click the time range picker on the right side of the page.

Click on the image to see it full-sized.
Step 3
Select All Years. It will tell you how long of history will be displayed.
Step 4
Click through the different statistics options available and toggle between a line and bar chart.
Step 5
You may also want to see the data charted in Quarterly or Rolling 12 months by selecting the drop-down on the left.

Click on the image to see it full-sized.
Your MLS may have fewer years of data available

Click the image for the full size
